Pharmacy intelligence from Leaf Health
Understand what is driving your pharmacy spend
LeafIQ brings pharmacy data into a consistent reporting experience for TPAs, brokers and employers. Explore cost and utilization, investigate changes, and bring clearer information to your next pharmacy review.
Request a demo'%3e%3cpath%20d='M25%2012.4626C25%2011.7478%2024.6897%2011.0629%2024.1491%2010.588L12.4925%200.340066C11.8519%20-0.184829%2010.9059%20-0.0898484%2010.3804%200.550024C9.87988%201.1599%209.93994%202.04972%2010.5105%202.58962L19.5145%2010.503C19.6246%2010.598%2019.6296%2010.763%2019.5345%2010.873C19.4845%2010.9279%2019.4144%2010.9579%2019.3393%2010.9629H1.5015C0.670671%2010.9629%200%2011.6328%200%2012.4626C0%2013.2925%200.670671%2013.9623%201.5015%2013.9623H19.3443C19.4895%2013.9623%2019.6046%2014.0823%2019.6046%2014.2273C19.6046%2014.3023%2019.5746%2014.3723%2019.5195%2014.4172L10.5155%2022.3307C9.86987%2022.8506%209.76977%2023.7954%2010.2903%2024.4402C10.8108%2025.0851%2011.7568%2025.1851%2012.4024%2024.6652C12.4374%2024.6402%2012.4675%2024.6102%2012.4975%2024.5802L24.1542%2014.3323C24.6947%2013.8574%2025%2013.1775%2025.005%2012.4576L25%2012.4626Z'%20fill='white'/%3e%3c/g%3e%3cdefs%3e%3cclipPath%20id='clip0_14_252'%3e%3crect%20width='25'%20height='25'%20fill='white'/%3e%3c/clipPath%3e%3c/defs%3e%3c/svg%3e) Request a demo
Request a demo
What is LeafIQ?
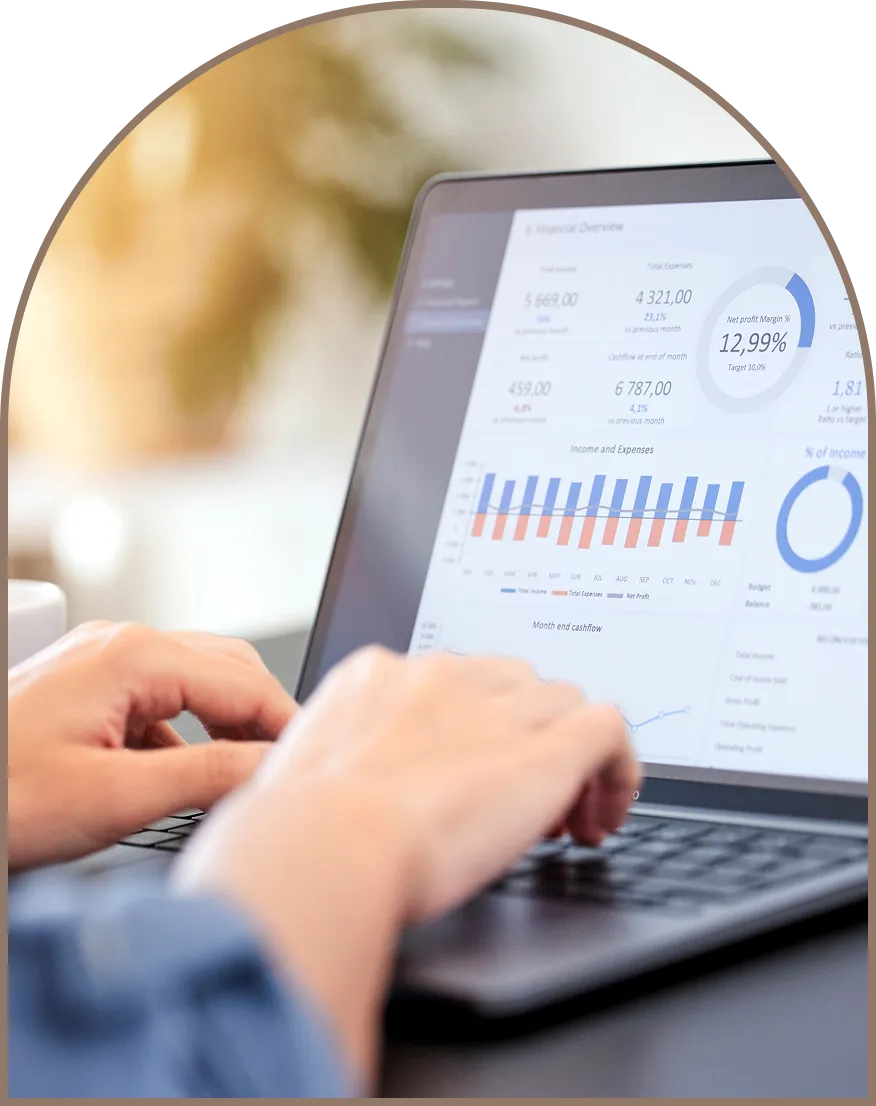
LeafIQ is Leaf Health's pharmacy analytics platform. It brings cost and utilization information into a consistent view so your team can understand what changed and where to look next.
Explore the data behind a pharmacy review, from overall spending to therapy classes and individual drugs. Use that detail to support clearer conversations with clients, benefit leaders and clinical teams.
Better visibility starts with better questions.
Explore the questions behind the numbers

Explore your available data
Filter by PBM, client, drug, therapy class, time period or cost type to explore the information available in your reporting views.

Understand what changed
What’s changed? What’s driving cost? Is this one drug, one member, or a broader trend?
Use those questions to focus your next pharmacy review.

Use a consistent reporting view
Bring available PBM data into a consistent reporting experience. Review the reporting period and definitions before comparing results.

Support your team’s review
Benefit leaders see the overall picture. Pharmacy teams explore drug and utilization detail. Advisors use the information to guide the discussion.
Discuss your reporting needs'%3e%3cpath%20d='M17%208.47454C17%207.98844%2016.789%207.52273%2016.4214%207.1998L8.49489%200.231193C8.05926%20-0.125735%207.41602%20-0.0611482%207.05866%200.373965C6.71832%200.788682%206.75916%201.39376%207.14715%201.76089L13.2699%207.14201C13.3447%207.2066%2013.3481%207.31878%2013.2835%207.39356C13.2494%207.43095%2013.2018%207.45135%2013.1508%207.45475H1.02102C0.456056%207.45475%200%207.91026%200%208.47454C0%209.03883%200.456056%209.49434%201.02102%209.49434H13.1542C13.2529%209.49434%2013.3311%209.57592%2013.3311%209.6745C13.3311%209.72549%2013.3107%209.77308%2013.2733%209.80368L7.15055%2015.1848C6.71151%2015.5383%206.64344%2016.1808%206.9974%2016.6193C7.35135%2017.0578%207.9946%2017.1258%208.43363%2016.7723C8.45746%2016.7553%208.47788%2016.7349%208.4983%2016.7145L16.4248%209.74589C16.7924%209.42295%2017%208.96065%2017.0034%208.47114L17%208.47454Z'%20fill='%23ED714C'/%3e%3c/g%3e%3cdefs%3e%3cclipPath%20id='clip0_14_281'%3e%3crect%20width='17'%20height='17'%20fill='white'/%3e%3c/clipPath%3e%3c/defs%3e%3c/svg%3e) Discuss your reporting needs
Discuss your reporting needs
Understand the numbers behind the change
Start with the overall view, then explore the details.
- Review plan cost, member cost and gross cost
- Explore spending by therapy class and drug
- Compare trends across reporting periods
- Identify changes that deserve a closer review
- Bring supporting detail to PBM performance discussions
Make pharmacy performance easier to explain.
During your demo, we’ll discuss your data sources, reporting scope and refresh schedule.

Built for the people responsible for pharmacy performance
- TPAs and brokers: prepare clearer client reviews and focus conversations on the changes that matter.
- Employers and benefit leaders: understand spending trends and bring informed questions to your partners.
- Pharmacy and clinical teams: explore drug and utilization detail to support further review.
- PBM oversight teams: use a consistent view to investigate performance and follow up on open questions.
Pharmacy reporting insights
Bring better questions to your next review
Three practical guides for reading pharmacy reports and turning findings into a focused conversation.
What a useful pharmacy dashboard should show
Read the guide
A useful dashboard starts with a clear question: what changed, what contributed to it, and what needs a closer look? A total alone rarely answers all three.
- Define the view. Identify the reporting period, included population and data source. Note whether the report uses paid dates or service dates and when the data was refreshed.
- Name the cost measure. Plan cost, member cost and gross cost answer different questions. Check which fees, rebates and adjustments are included before treating two totals as comparable.
- Show the drivers. Explore trends by therapy class and drug. Separate a change in utilization from a change in cost per prescription when the available data supports that distinction.
- Record the next question. Connect each finding to an owner and a follow-up, such as checking a data exception or asking for supporting claim detail.
Before comparing two periods, confirm that the definitions and population are consistent. Where they differ, explain the difference alongside the chart.
For context on the categories used in federal prescription drug cost reporting, see the CMS RxDC overview. A dashboard review does not replace that reporting process.
Five questions to bring to a PBM review
Read the guide
Use your review to connect the reported result with its definitions, supporting data and next steps.
- What changed? Ask which drugs, therapy classes or utilization patterns contributed to the difference from the prior period.
- Are we comparing the same things? Confirm the population, dates, cost measures and treatment of reversals or adjustments.
- What is included in the reported cost? Ask how member payments, administrative fees and rebates are reflected. Identify anything reported separately or still outstanding.
- How does the result relate to our agreement? Review the applicable definitions and supporting detail with your contract and benefit advisers.
- What happens next? Assign an owner, due date and evidence needed for each open item.
Keep the reporting discussion specific. A useful follow-up identifies the question, the data needed to answer it and how the result will be confirmed.
Estimated savings and achieved savings: keep the distinction clear
Read the guide
A savings estimate describes a possible result under stated assumptions. An achieved result needs evidence from the relevant period. Labeling them clearly helps a team understand what is proposed, what has been implemented and what has been verified.
- For an estimate: record the baseline, population, time period, assumptions, expected implementation date and included costs.
- For an implemented change: confirm when it took effect and which claims or members were within scope.
- For a measured result: compare a consistent baseline and period, explain material changes in utilization or population, and account for relevant fees and adjustments.
- For payments or rebates: distinguish amounts expected, amounts reported and amounts actually received.
A lower total spend does not, by itself, show what caused the change. Present the calculation and any limitations with the result, and keep unresolved amounts visible for follow-up.
See how LeafIQ could support your team
Tell us what you need to understand about your pharmacy program. We’ll walk through the relevant reporting views and discuss your data sources, priorities and next steps.
Request a demo